When it comes to navigating the fast-paced world of Forex trading, having the right tools and platforms at your disposal can make all the difference. Libertex, a trusted name in the world of online trading, offers traders an accessible and powerful platform. Coupled with the best Forex indicators, Libertex can help traders make informed decisions and maximize their potential for profit. In this article, we will explore the importance of technical vs. fundamental analysis, define what technical indicators are, explain how Forex indicators work, and discuss the different types of trading indicators that can elevate your trading strategy.
1. Technical vs. Fundamental Analysis
When diving into Forex trading, one of the first decisions traders must make is whether to focus on technical analysis or fundamental analysis—or a combination of both.
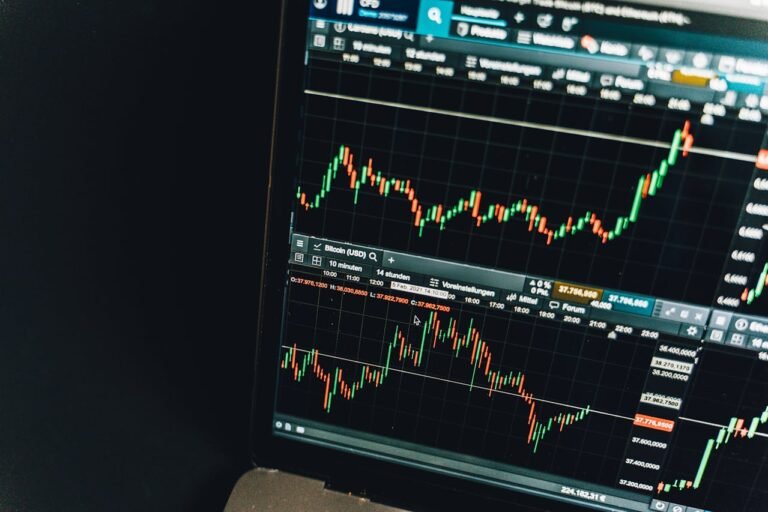
Technical analysis involves examining historical price charts and using technical indicators to forecast future price movements. This method is based on the belief that all relevant market information is already reflected in the price, making it possible to predict future trends by analyzing past market data. Technical analysis is highly favored by traders who rely on chart patterns, price movements, and various indicators to make their trading decisions.
On the other hand, fundamental analysis focuses on the economic, financial, and geopolitical factors that may affect currency prices. This includes analyzing interest rates, inflation rates, political stability, and economic performance indicators like GDP growth. Fundamental analysis is typically preferred by traders who are interested in understanding the broader economic landscape and how it might impact the value of currencies over time.
Both methods have their merits, and many traders find success by combining elements of both technical and fundamental analysis to create a comprehensive trading strategy.
2. Definition of Technical Indicator
A technical indicator is a mathematical calculation based on historical price, volume, or open interest information that traders use to forecast future price movements in the Forex market. These indicators are an essential part of technical analysis and are used to identify trends, reversals, and other key market signals.
Technical indicators can be broadly categorized into two types:
- Leading Indicators: These indicators predict future price movements, giving traders an early signal to enter or exit a trade. They are particularly useful in identifying potential trend reversals.
- Lagging Indicators: These indicators follow the price movements and are typically used to confirm trends. While they may not predict future price changes, they help traders confirm that a trend is in place before making trading decisions.
Understanding and correctly applying technical indicators can give traders a significant edge in the market, enabling them to make more informed decisions.
3. How Forex Indicators Work
Forex indicators work by processing historical price data through mathematical formulas to generate signals that can help traders predict future price movements. These signals are often visualized on price charts, providing traders with a graphical representation of potential trading opportunities. In the ever-evolving landscape of Forex trading, staying ahead of the competition requires not just knowledge of the best Forex indicators but also leveraging advanced technologies. One such innovation is FTMÇ, a technology that has been integrated into platforms like Libertex to enhance trading efficiency and accuracy. By utilizing FTMÇ, traders can gain deeper insights and execute strategies with greater precision, making it a valuable addition to any trader’s toolkit.
The working mechanism of Forex indicators involves the following steps:
- Data Collection: The indicator gathers historical price data, including opening, closing, high, and low prices for a specific period.
- Calculation: The indicator applies a mathematical formula to this data to calculate a value or a series of values that are plotted on the chart.
- Signal Generation: Based on the calculated values, the indicator generates signals that traders can use to enter or exit trades. These signals might be in the form of crossovers, divergences, or overbought/oversold levels.
- Interpretation: Traders interpret these signals in the context of their overall trading strategy, taking into account other indicators, market conditions, and their own risk tolerance.
Indicators can be used in isolation or combined with other indicators to create a more robust trading system. The key to success lies in understanding how each indicator works and using it in a way that aligns with your trading strategy.
4. Types of Trading Indicators
There are several types of trading indicators that Forex traders can use, each with its own unique purpose and application. Below are some of the most commonly used indicators:
Moving Averages (MA)
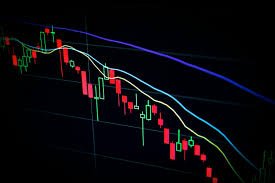
Moving Averages are among the most popular indicators used in Forex trading. They smooth out price data to create a single flowing line that traders can use to identify trends. There are different types of Moving Averages, such as Simple Moving Averages (SMA) and Exponential Moving Averages (EMA), each with its own calculation method and application.
Relative Strength Index (RSI)
The RSI is a momentum oscillator that measures the speed and change of price movements. It ranges from 0 to 100 and is typically used to identify overbought or oversold conditions in the market. When the RSI crosses above 70, the market is considered overbought, and when it falls below 30, it is considered oversold.
Bollinger Bands
Bollinger Bands consist of a middle band (usually a 20-period SMA) and two outer bands that are typically two standard deviations away from the middle band. These bands expand and contract based on market volatility, making them useful for identifying potential breakouts and price reversals.
Moving Average Convergence Divergence (MACD)
MACD is a trend-following momentum indicator that shows the relationship between two moving averages of a security’s price. It consists of the MACD line, the signal line, and the histogram. Traders use MACD to identify potential buy and sell signals when the MACD line crosses above or below the signal line.
Fibonacci Retracement
Fibonacci Retracement is a tool used to identify potential support and resistance levels based on the Fibonacci sequence. Traders use this indicator to find retracement levels where the price is likely to reverse during a trend.
Each of these indicators serves a different purpose, and traders often use them in combination to get a more complete picture of the market. The key is to choose the indicators that best suit your trading style and strategy.
5. Conclusion
In conclusion, mastering Forex trading requires a deep understanding of both the tools and strategies that drive success in the market. Libertex offers a reliable platform for traders, and when combined with the best Forex indicators, it can significantly enhance your trading performance. Whether you prefer technical analysis, fundamental analysis, or a combination of both, the key is to continuously learn, practice, and refine your strategies.
Remember, the best trading decisions are informed by a mix of knowledge, experience, and the right tools. By leveraging the power of technical indicators and the robust features of Libertex, you can approach the Forex market with confidence, ready to capitalize on the opportunities it presents.
Brit is a passionate writer with a love for storytelling and exploring the depth of human experience through words. With a keen eye for detail and a thoughtful voice, Brit crafts pieces that resonate with readers and spark meaningful reflection. When not writing, Brit enjoys quiet moments with a good book, long walks, and finding inspiration in everyday life.


